LID: imageanalyzer
Saurin B Parikh
phenomics
genomics
computational biology
yeast
microbiology
high-throughput
screening
colony
colony size
Abstract
LI Detector's imageanalyzer function makes the use of the MATLAB Colony Analyzer Toolkit to generate colony size estimations from image files.
Steps
Photo Ethics
Photos should be organized as Experiment > Arm > Stage > Hours
-
Within the Hours folder the photos should be arranged in the same order as the plate names/number
-
Example - If you were conducting an experiment using the mutant collection
  - The experiment had two parallel arms going from 384 density plates (Starter Plates) to 1536 density plates (Pre-screen) to 6144 density plates (Final Screen)

  - Photos for the Starter Plates and Pre-screen were taken at saturation and those for Final Screen were taken at 0, 4 and 12 hours

  - Then the folder heirarchy would be as follows:

      - Experiment

          - Arm \#1

              - Starter Plates

                  - 36h

                      - Plate 1

                      - Plate 2

              - Pre-screen

                  - 20h

                      - Plate A

                      - Plate B

              - Final Screen

                  - 00h

                  - 04h

                  - 12h

          - Arm \#2

              - Starter Plates

                  - 36h

              - Pre-screen

                  - 20h

              - Final Screen

                  - 00h

                  - 04h

                  - 12h


  - If the bifurcation of the arms occur later in the experiment then the folder heirarchy could be as follows:

      - Experiment

          - Starter Plates

              - 36h

                  - Plate 1

                  - Plate 2

          - Pre-screen

              - 20h

                  - Plate A

                  - Plate B

          - Arm \#1

              - Final Screen

                  - 00h

                  - 04h

                  - 12h

          - Arm \#2

              - Final Screen

                  - 00h

                  - 04h

                  - 12h


  - Make sure the terminal folders containing the photos are names is a ' **tt** h' manner like shown above
Image Quality Check
- Are all the images in the right orientation? - top left corner of the plate should be at the top left corner of the image.
- Are there the expected number of images in your folders?
- Do all the images have a uniform black background? Any 'white' in the background will cause the MATLAB Colony Analyzer Toolkit (MCAT) to falsely select it as a colony and fail.
- Make sure that all the images are ordered correctly.
- Take note of any 'smudges' or problem colonies on the plates. One might consider adding these to the smudgebox when prompted.
LI Detector Analytical Pipeline
Execute Step 1 to 7 of the LI Detector Analytical Pipeline
Note: The order of the plates in the upscale pattern from Step 6 of the pipeline should be the same as the order of images within the folders.
ImageAnalyzer
Information to keep in hand before proceeding:
- Path to MALTAB directory
- Path to lidetector directory
- Path to where the JDBC driver was unzipped from Step 3 of LI Detector Analytical Pipeline
- Path to the 'Stage' level photos from Step 1
- Location of any smudges on the plates ie the colonies you want to remove from the analysis because of any technical issues - plate number, row number, column number
Execute the Image Analyzer
~/MATLAB/lidetector$ ./imageanalyzer.sh
User will be asked to verify binary files before uploading raw pixel count data
- Each image will now have 3 additional files - .binary, .cs.txt and .info.mat
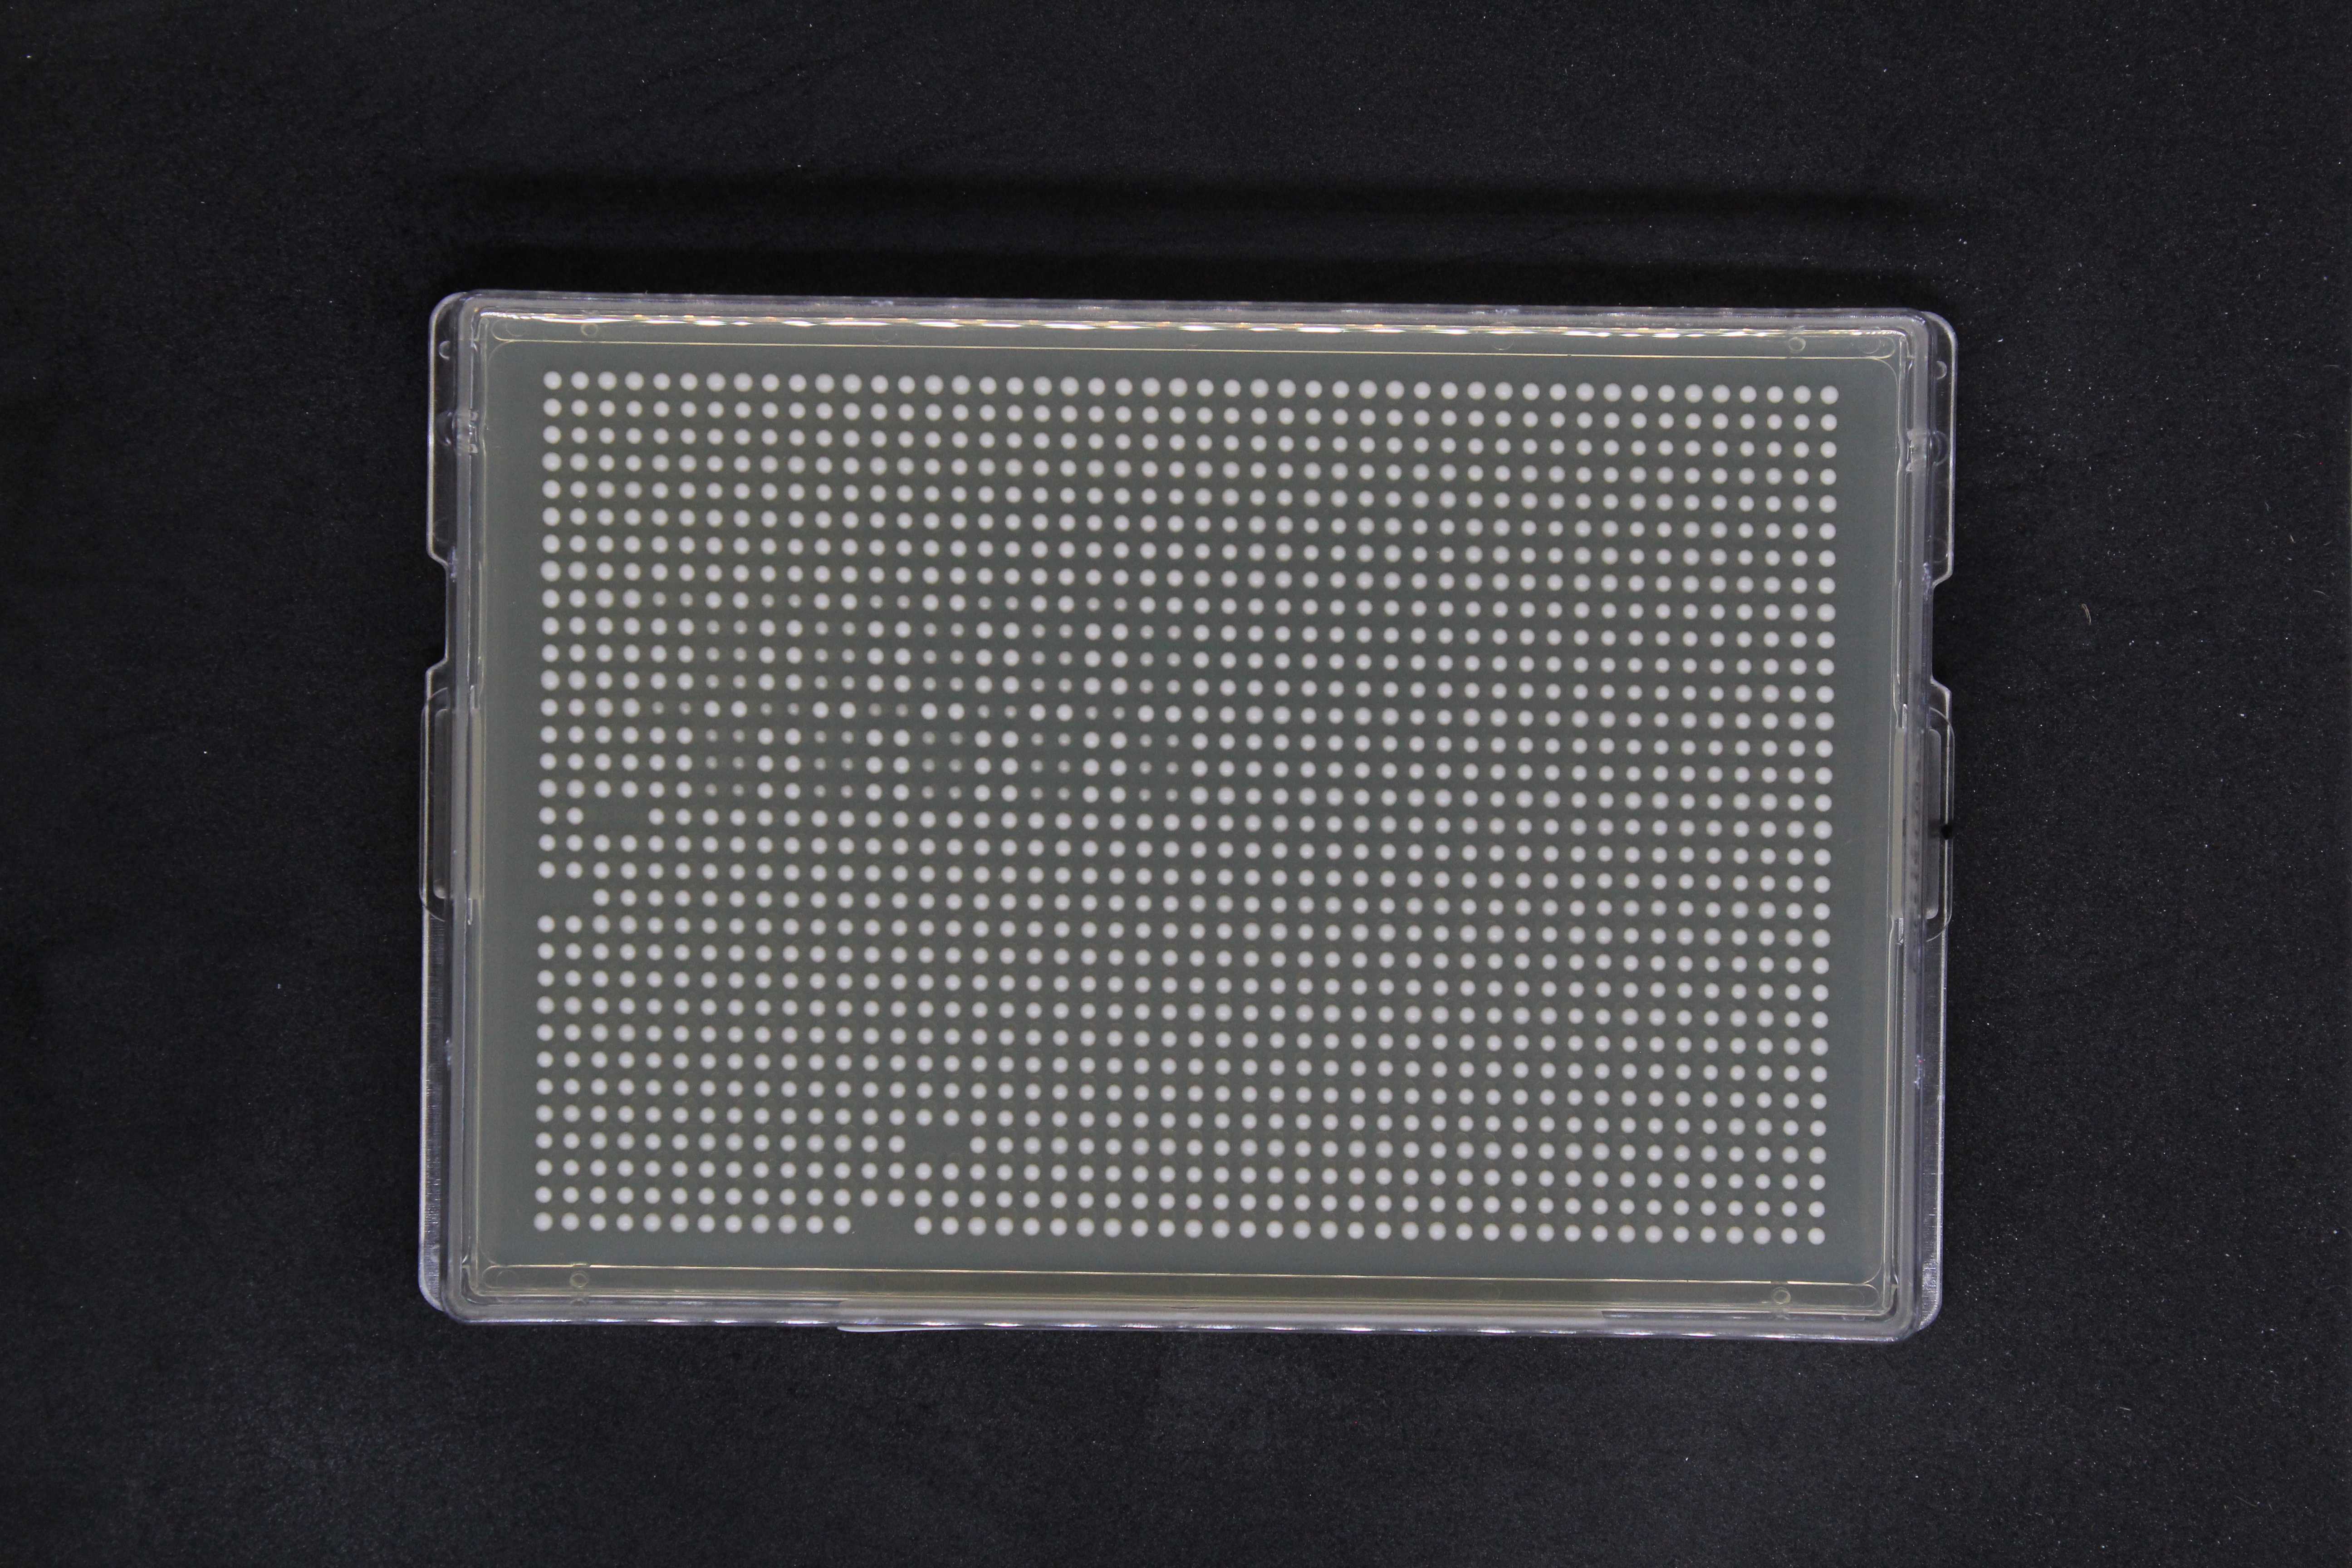
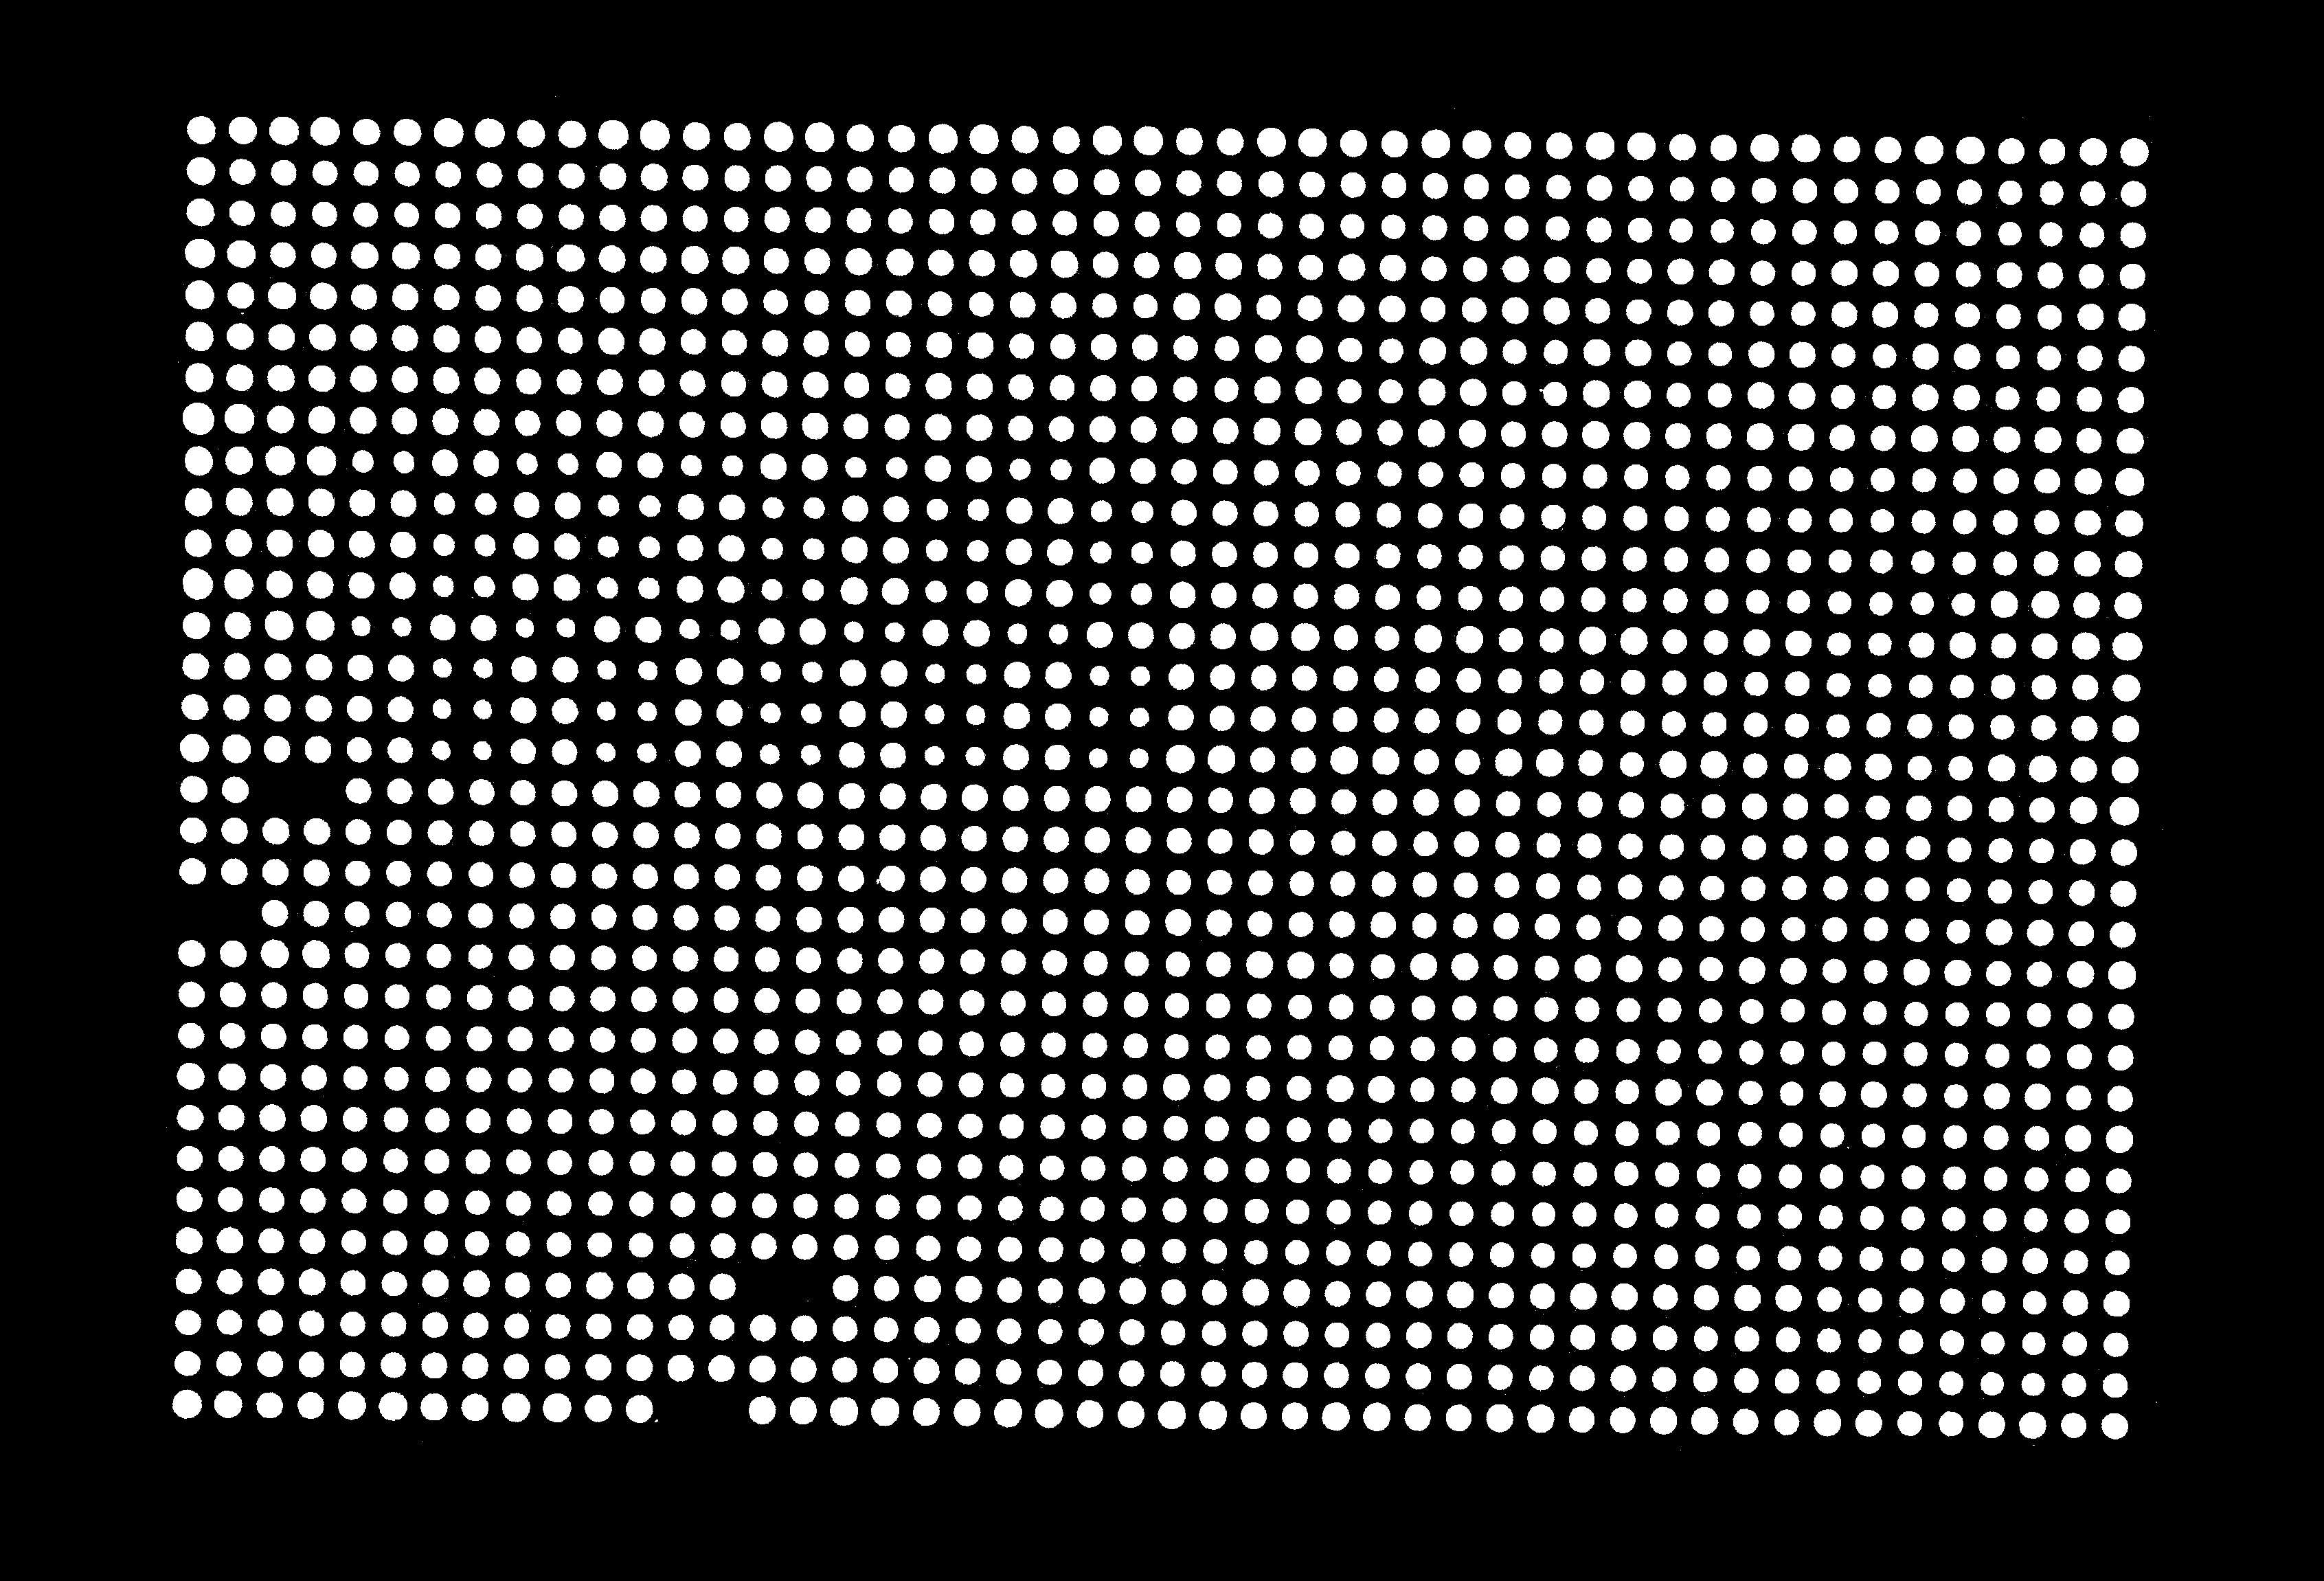
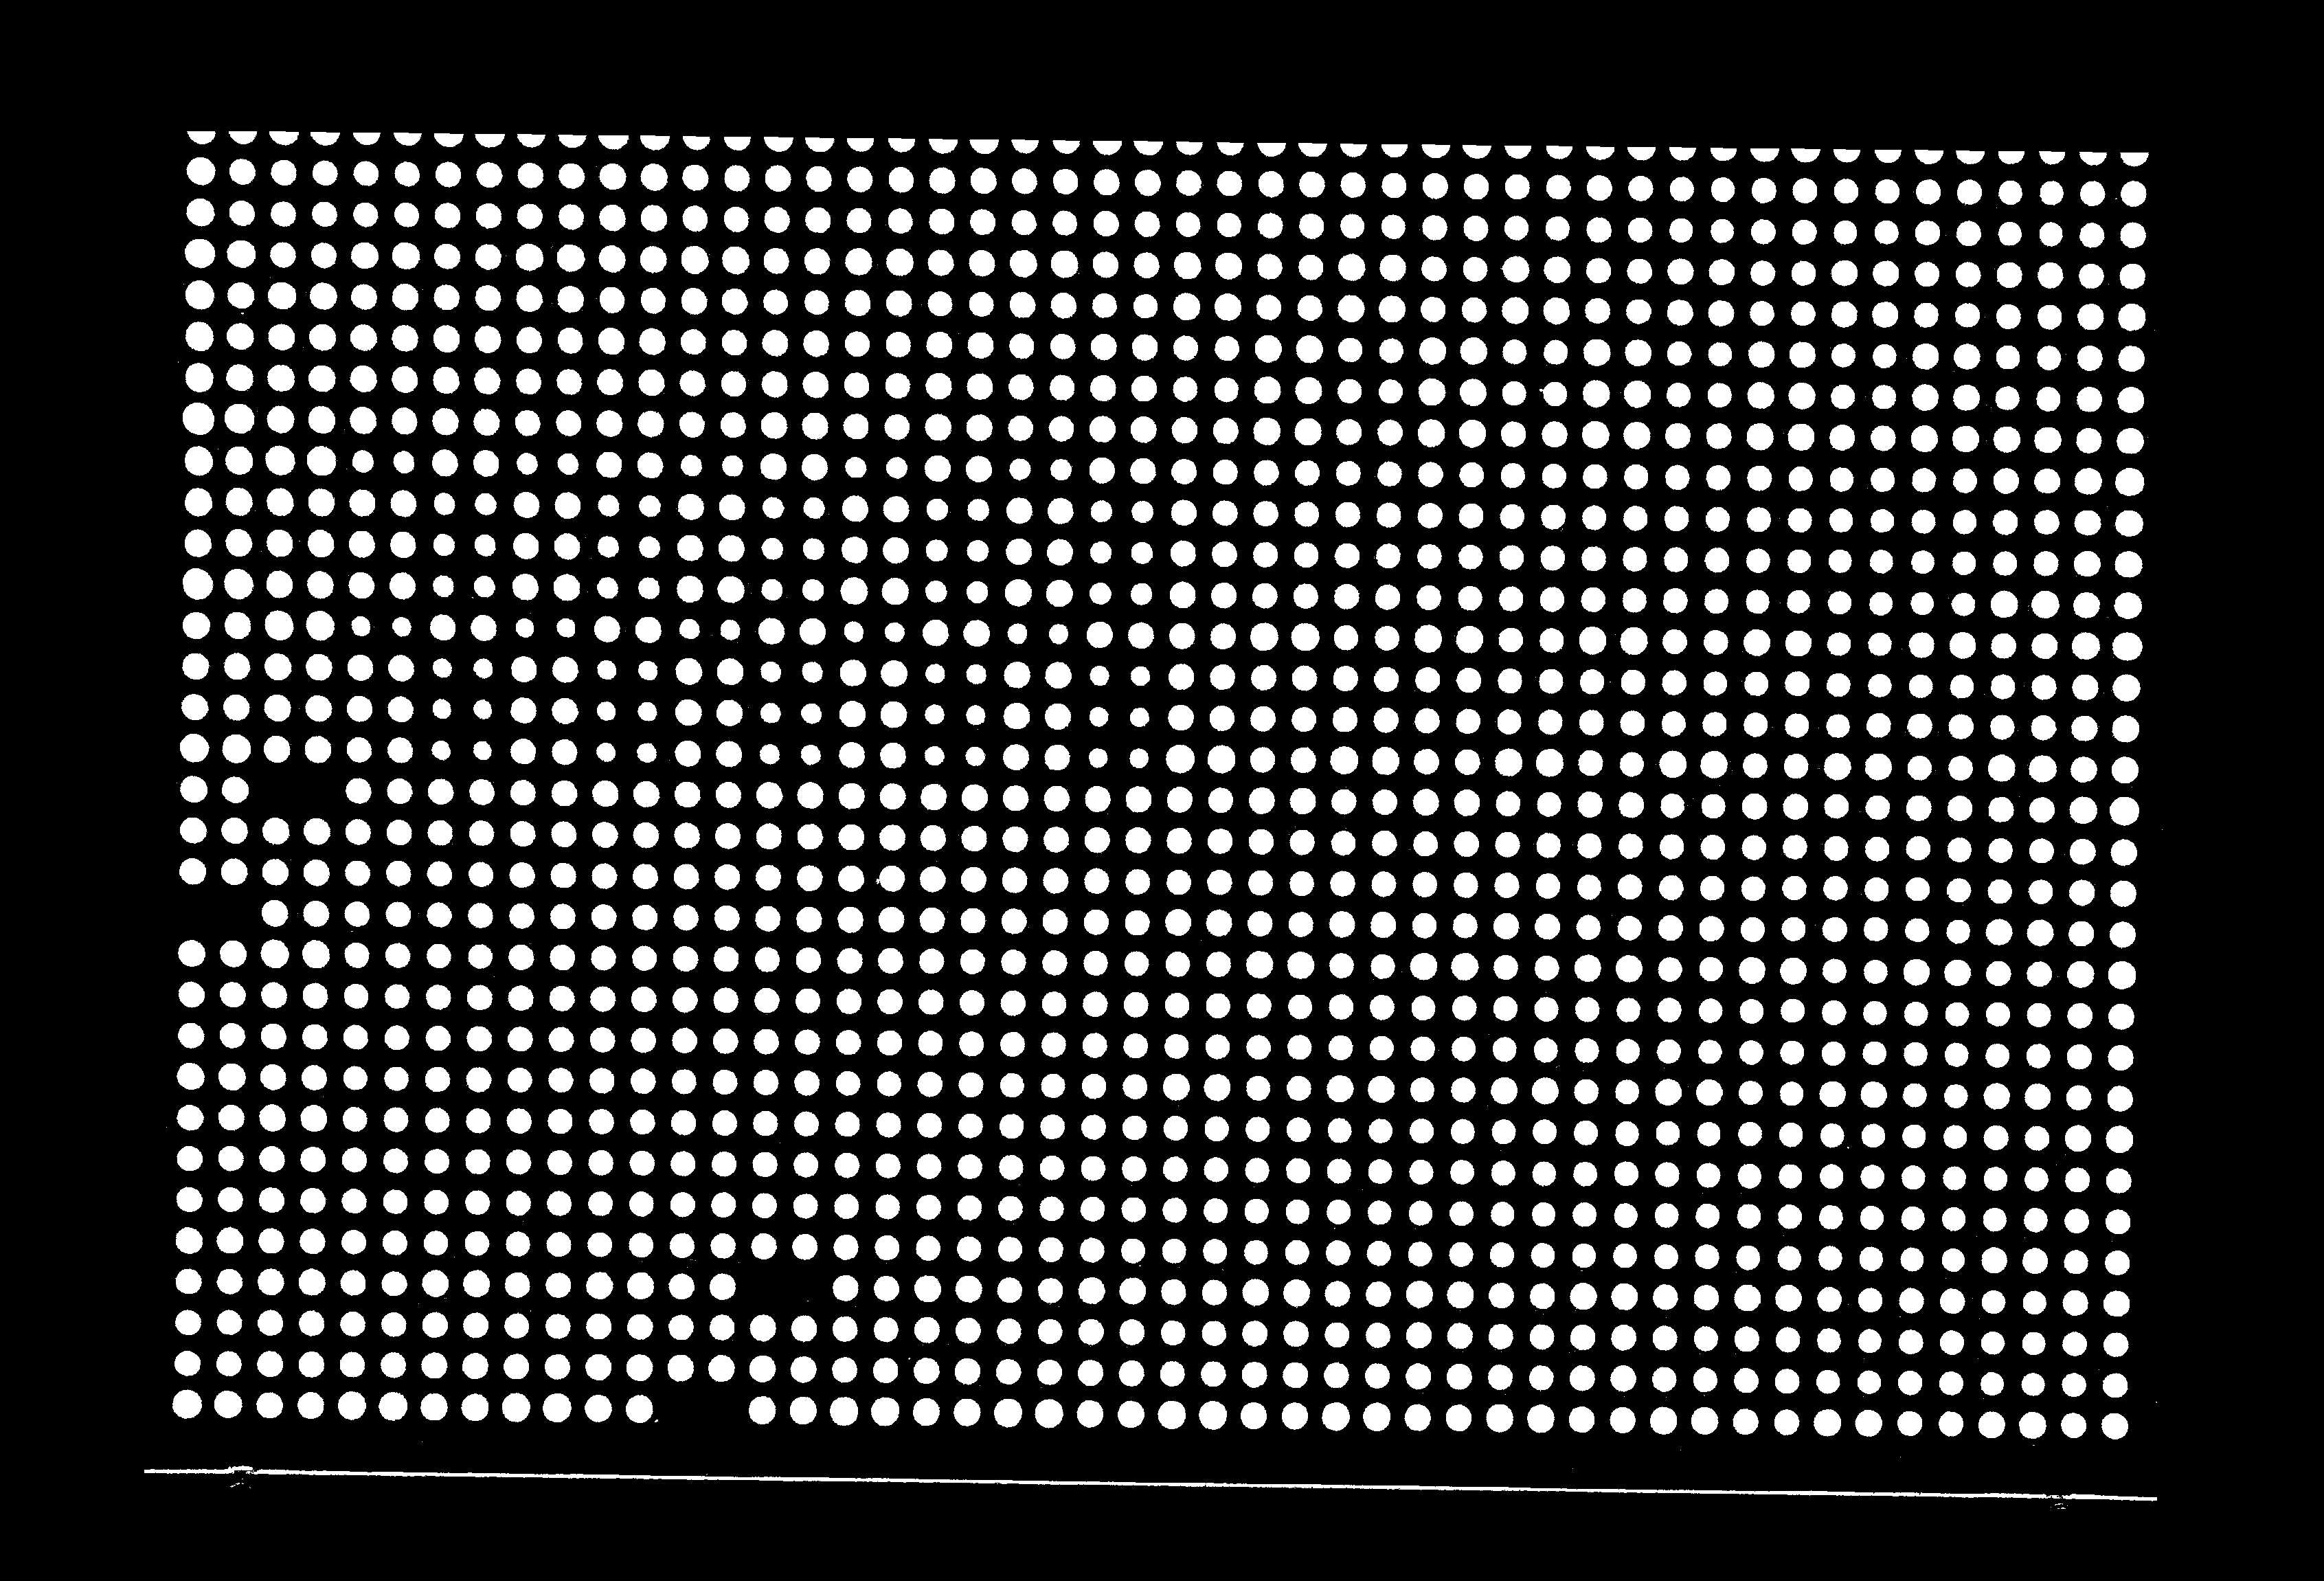
- View the .binary file (using Preview in Mac) to verify if the colonies have been correctly identified
- Original image:
-
Good binary image:
-
Bad binary image:
-
Proceed to upload only if all binary files are 'good.'
Successful completion of this command will generate:
- _RAW = raw colony size estimations per hour per position id of all the images
- _ smudgebox = position ids to be excluded from analysis that correspond to the user defined coordinates
- _JPEG = clean version of the raw table with border colonies, colonies corresponding to the smudge box and those colonies with pixel count of less than 10 NULL'd
Example files can be found in Data.zip.
