Histological image quantification of picrosirius red stained skeletal muscle sections
John Hildyard, Emma Foster, Dominic Wells, Richard Piercy
Abstract
Picrosirius Red (PSR) staining of skeletal muscle tissue sections permits histological evaluation of muscle fibrosis: muscle fibres are stained a vivid picric acid yellow, while connective tissue is stained a vibrant Sirius red.
Connective tissue can also be visualised via brightfield, fluorescence or polarized light microscopy, but no standard approach for image quantitation is currently employed.
This protocol provides a method to robustly quantify images collected from such stained muscle sections, using the Hue/Saturation/Brightness (HSB) colour-space, integrated into a high-throughput semi-automated macro written for the open-source imagej distribution, Fiji.
Note: PSR staining is usually restricted to formalin fixed paraffin-embedded (FFPE) tissue: staining of fresh frozen tissue uses a method developed by Hadi et al (https://www.ncbi.nlm.nih.gov/pmc/articles/PMC3162624/): an optimised version of this protocol is also included here.
Before start
Prepare tissue sections (cryosections) as per materials
Prepare PSR staining solution, xylene, graded alcohols and 0.5% acetic acid solution (see materials)
Steps
PSR staining
Prepare solutions and reagents (see materials)
Remove slides* from -80 and allow to equilibrate to room temperature.
Note: for best results stain slides in large batches (~24 slides or more) -staining is comparable between batches but most consistent within batches
*see materials
Place slides in staining rack, immerse directly in xylene, leave for 0h 20m 0s-1h 0m 0s
Remove slides from xylene, allow to dry completely (0h 5m 0sin fume hood)
Rehydrate slides through graded alcohols (100%>>90%>>80%>>70%, at least 0h 5m 0sin each) then place into distilled water (5min)
STAINING
Immerse rehydrated slides directly into PSR staining solution (see materials), incubate at room temp for 45-50mins
-Note: timing is critical for this step. Longer incubations result in sirius red staining of muscle fibres, shorter incubations reduce overall stain intensity
FIXATION
Rinse slides in distilled water (dip briefly)
Immerse slides in 0.5% acetic acid (see materials) for 0h 2m 0s
DEHYDRATION
Rinse slides in distilled water (dip briefly)
Dehydrate through graded alcohols (70%>>80%>>90%>>100%) -use brief incubations (<2mins) for 70% and 80%, longer (5min) for 90% and 100% -some picric acid stain is lost at lower alcohol concentrations.
Remove from 100% ethanol, allow to dry completely (5-10mins)
Incubate in xylene for at least 1hr (can be overnight, but too long in xylene will result in slight destaining)
Mount/coverslip using DPX, allow to dry overnight
Stopping point: QC
Mounted slides can be stored indefinitely for future analysis or to create a sample archive.
For QC, inspect slides via microscope.
Connective tissue should be a sharp, deep red, while muscle fibre cross-sectional area should be yellow, with a clear distinction between the two.
Regenerating (small) myofibres/myotubes may appear pale yellow due to lower levels of contractile protein.
Troubleshooting:
Myofibre area stained orange/red: slides stained for too long
Low overall staining intensity: insufficient staining time, or sections too thin (may not prevent correct quantification)
Myofibre area very pale/washed out: slides incubated in water/70%/80% alcohol for too long after staining, or staining solution exhausted (make fresh stain)
Image collection
Image collection should be performed via brightfield microscopy using a 10x objective: a minimum of 3 (ideally 5-6) representative imaging fields should be selected and captured at random.
Capture images in TIFF (.tif) format.
Notes: care should be taken to ensure images are representative. It is often helpful to survey the entire section to identify any regions that do not reflect general tissue architecture (large deposits of epimysial connective tissue, tendon, etc) such that these specific regions can be avoided.
Where possible, image collection should be conducted blind to sample identity/treatment group.
All images should ideally be captured using the same camera settings (exposure time etc), though most features of downstream analysis are robust to slight differences.
Store all images in a single folder for ease of analysis
Image analysis
Open fiji (imagej distribution, can be downloaded from https://imagej.net/software/fiji/downloads)
Run the PSR_quantify macro by selecting plugins>>macros>>run.. and navigating to the folder holding PSR_quantify.ijm
The macro will request
-
an input directory: this is the folder where your .tif format images should all reside
-
an output directory: this is the folder where you would like data automatically saved (can be the same as input)
-
a sampleID: this is the unique identifier that will be prefixed to all data saved automatically (do not use spaces)
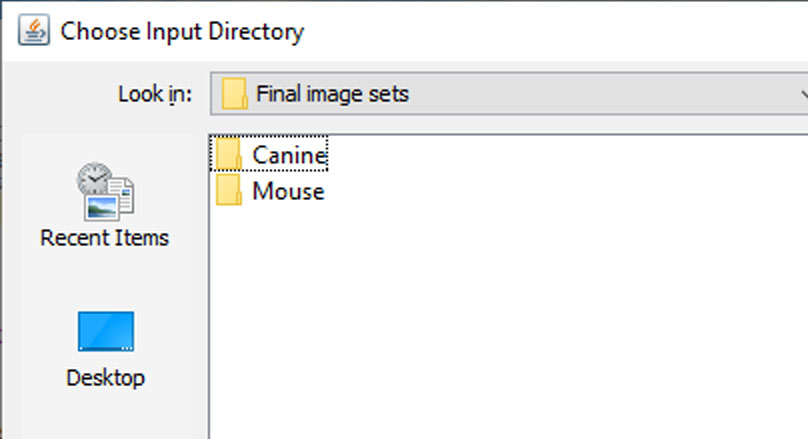
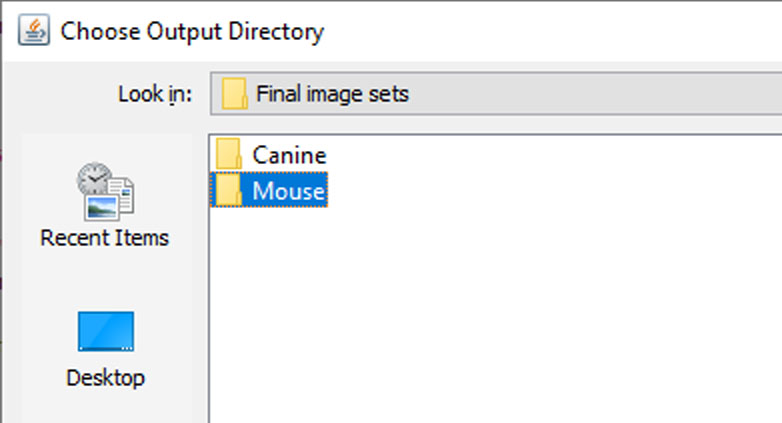
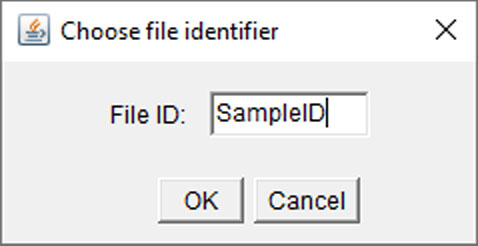
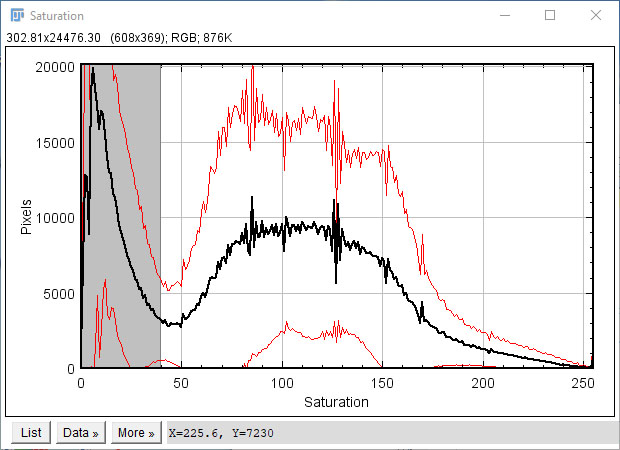
The macro will now iterate through the entire image collection and extract the hue (H) and saturation (S) channels of each image, and generate 0-255 histograms corresponding to the mean +/- standard deviation for the entire image collection as a whole.
Saturation reflects stain intensity: low saturation values represent slide background, and should be excluded from analysis -the default threshold for background subtraction (0-40) is overlaid on the saturation histogram, but can be adjusted accordingly (see below)
Hue represents the stain hue (colour): red hues occupy the lower (0-23) and upper (234-255) ranges of the spectrum, while yellow hues typically span from 23-50. PSR stained muscle should exhibit a prominent peak corresponding to yellow, with more modest peaks corresponding to red regions. Suggested ranges for red (orange overlay) and yellow (yellow overlay) are overlaid on the histogram, but can be adjusted accordingly (see below)
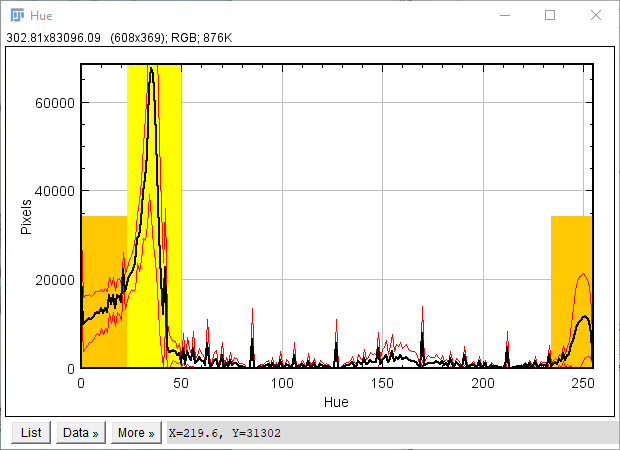
Adjust parameters accordingly: using the histograms above, the user can adjust the specific threshold values chosen.
Saturation cutoff: the range of saturation values to exclude as slide background (grey region on saturation histogram, typically 0-40)
Red threshold: the start of the upper range of red hue values (upper orange region on hue histogram, typically 234+)
Yellow range: the range of hue values corresponding to the yellow peak (yellow region on hue histogram, typically 23-50)
The lower value of the yellow range defines the boundary between red and yellow, and is less clearly defined than other parameters. This value should thus be selected with some care. 23 is the default value, but quantification is robust to minor variations (20-25), and provided the same value is selected for the entire image collection, analysis should remain consistent.
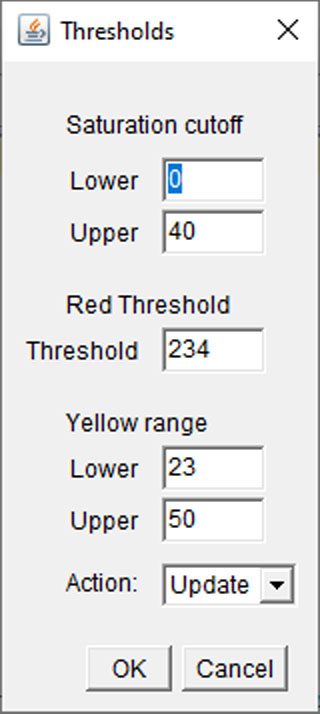
Selecting "update" under action will redraw the threshold regions on the hue/saturation overlays. Once satisfied, select "accept" under action to continue with analysis.
The macro now iterates through the entire image collection again.
For each image, the macro
-
create a local duplicate
-
extracts the hue and saturation channels
-
uses the saturation threshold selected above to generate a background subtraction mask
-
applies this mask to the hue channel
-
extracts total "red" and "yellow" pixels according to the thresholds selected above
-
adds these to a table
-
deletes all duplicated channels/images


The macro then generates a results table: the first column is a key, and each image is then assigned a unique column (image names in column headers).
Key:
-
Red (value): per-image total of red pixels using the red-threshold value shown in (value)
-
Yellow (value range): per-image total of yellow pixels using the yellow-threshold range shown in (value range)
-
Other: per-image total of non-background, non-red, non-yellow pixels -SHOULD BE SMALL
-
Red fraction (red&yellow): per-image fibrosis fraction. Red pixel count divided by red+yellow counts.
-
Red fraction (total): per-image fibrosis fraction including "other". Red pixel count divided by red+yellow+other counts. -Usually essentially identical to red&yellow fibrosis fraction, but included for completeness.
-
Background (value range): per-image total of background pixels using the saturation threshold range shown in (value range).

The results table is saved automatically as a comma separated values (.csv) file.
Image collection individual saturation/hue histograms, and the mean and standard deviation plot values are also automatically saved as .csv files.
All results and histogram data is saved using the SampleID specified
Data can be imported into excel for analysis. It may be helpful to transpose columns/rows such that numerical data values fall within single columns rather than rows.
Per-sample fibrosis fractions can be determined by averaging (arithmetic mean) all per-image values for that sample.
Fibrosis fraction data is normally distributed, and can be statistically assessed accordingly.
Note that all connective tissue is included within the fibrosis fraction : no distinction is made between "healthy" and "pathological" connective tissue, and thus even healthy samples will typically have fibrosis fraction values of 0.1-0.2.
Assigning fibrosis fraction values in this manner avoids any requirement for establishing specific 'pathological' thresholds -fibrosis is a spectrum phenomenon and should be assessed as such.
No primary image data is altered at any time: the analysis can be repeated using different parameters if necessary.

